


The App is Back! Don’t forget to download the NBC Sports EDGE app to receive real-time player news, mobile alerts and track your favorite players. Plus, now you can check out articles and player cards. Get it here!
In this week’s “By The Numbers” breakdown, the analysis will focus on hang time and how the new baseball has impacted offensive production in major league baseball. It has been discussed all season how the construction of the new ball has increased overall exit velocity, but while creating an overall “drag” effect which has impeded the overall impact of batted balls.
First, we will briefly discuss the changes that MLB has made to the newly manufactured baseballs as a quick refresher. This will include a look at the intended impact versus the actual impact. Secondly, we will break down the actual batted ball data to identify where production has been affected this season and how to use that information in your player analysis. Lastly, we will put a microscope on which players may have been influenced the most by these changes. [[ad:athena]]
The wild card in this analysis could be the upcoming crackdown on foreign substances in baseball. Offensive production is likely to see an uptick in the near future. In fact, there has already been a wave of improved offense ever since the threat of upcoming enforcement:
MLB stats for 10 days leading up to MLB's warning shot June 3:
— Travis Sawchik (@Travis_Sawchik) June 13, 2021
9.1 BB% /24.5 K%/ .231 batting average
Ten days since June 3:
8.5 BB% /23.6 K%/ .245 batting average
The takeaway from this variable should be that while overall offensive production should improve, the lasting impact of the new baseball should continue. The only difference is that it will be less obvious through surface statistics to identify the root of improvement. Overall, the lessons learned in this week’s research should act as a general observation that should help your decision-making process moving forward this season.
I would also like to thank Paul Mammino of RotoFanatic.com for creating some of the visualizations used in this article.
The New Baseball
In early February, Ken Rosenthal and Eno Sarris of The Athletic reported that they obtained an internal memo that Major League Baseball sent to general managers that “slight changes” would be made to the baseball in order to slightly reduce offense during the 2021 season. The notable changes listed were reducing the weight of the ball by less than one-tenth of an ounce, and also a slight decrease in the bounciness of the ball as measured by the COR (coefficient of restitution, or the relationship of the incoming speed to the outgoing speed). Long story short, the new baseball would be less bouncy.
Major League Baseball seemed to insinuate that there would be a slight decrease in offense, but when the KBO (Korean Baseball Organization) made similar changes, home runs dropped by one-third and slugging percentage dropped by 14 percent. The one major difference is MLB reduced the weight of the baseball by 2.8 grams while the KBO actually increased the weight by one gram.

Overall, the expectation given by Major League Baseball reducing the COR of the baseball was to expect a slight decrease in fly ball distance. However, results to date have proven to be inconclusive as far as rest of season expectations. In spring training there was an obvious bump in overall home run output, but with the ball having an overall “drag” effect. Why the jump in home runs on contact? The new ball was producing higher exit velocities. That seems to be counterintuitive considering that a baseball with high drag should produce fewer home runs, not more.
In the regular season we have witnessed far closer to what should have been expected with the reduced COR, which is a reduced number of home runs. The discrepancy between the spring and regular season could have been level of competition or even weather, but one thing remained consistent. The new baseball was still producing both high drag and higher exit velocity
Beware of the Air
The data currently leads to the probable conclusion that hang time, or total time in the air, may have the biggest impact on batted balls this season. After all, if you generate a higher exit velocity, you would want that effect to last as long as possible. So theoretically how would one take advantage of a higher exit velocity without allowing the “drag” to influence the batted ball?
You hit line drives.

As you can see in the chart above displaying batted ball data from 2019-2021, there is a very tight variance from year to year in league-wide batted ball production. In fact, the percentage in which these batted ball events are distributed is almost identical from season to season:

Ground Ball Production
There is virtually no difference in ground ball production, which one could assume may get a bump with higher exit velocity. This may have been the case, but a rise in defensive shifts likely had a hand in erasing any possible gains. In 2019 Major League Baseball shifted 25.6 percent of the time. In 2021 that number has risen to 32.3 percent, with teams like the Mets increasing from 14.1 percent to 55.2 percent over that time period.
Line Drive Production
Line drives have seen a slight but steady decline in batting average and most notably slugging percentage, but have remained mostly consistent with weighted runs created plus (wRC+). If you are hitting line drives, you are going to be successful. This will remain true for as long as baseball exists and it should not surprise you to find the league leaders in line drive percentage having successful seasons:
- Nick Castellanos (32.2%) .361/.416/.635 with 13 home runs, 44 runs, and 36 RBI
- Yoan Moncada (31.7%) .280/.402/.408 with 5 home runs, 31 runs, and 32 RBI
- Teoscar Hernandez (31.6%) .294/.343/.487 with 10 home runs, 25 runs, and 40 RBI
- Michael Brantley (31.5%) .337/.381/.487 with 3 home runs, 29 runs, and 21 RBI
- Adam Frazier (29.3%) .336/.396/.474 with 2 home runs, 36 runs, and 24 RBI
Fly Ball Production
This is where the drop-off in production starts to come into focus. Over the past three seasons there has been a 21 point drop in batting average and 76 point drop in slugging percentage, and 1.7% decrease in HR/FB percentage. Many of the league leaders in fly ball percentage are hitting well below the already low league batting average of .230:
- Austin Meadows (.233)
- Adam Duvall (.201)
- Kyle Seager (.214)
- Matt Chapman (.221)
- Jorge Soler (.178)
- Eugenio Suarez (.171)
However, there are many hitters that have been able to maintain a high fly ball rate and have sustained success this season, such as Nolan Arenado and Ronald Acuna. It should be no surprise that those players have done this while maintaining a line drive rate above 20 percent for the season, an area that most of the players who have struggled have failed to maintain.
The question is whether there is a particular subset of fly balls that are more vulnerable to the drag effects of the new baseball. Time to dig into barrels and launch angle.
Vulnerable Batted Balls: Barrels
It stands to reason, without researching, that barrels would still be the “king” of Batted Ball Events. As a refresher, a “Barrel” is a baseball struck at an ideal exit velocity and launch angle. To be “Barreled”, a batted ball requires an exit velocity of at least 98 miles per hour with a launch angle between 26-30 degrees, with the launch angle expanding for every mile per hour over 98.
Here is a chart showing the production of Barreled baseballs from 2019-2021 through batting average:

Here is a chart showing the production of Barreled baseballs from 2019-2021 through slugging percentage:

There is a gradual and obvious drop-off in each of the charts showing that Barreled baseball are losing their potency. Our previous research shows that line drives have not taken a back seat in production so it stands to reason that a drop-off in barrels would be due to a subset with a higher launch angle. This would leave the baseball more vulnerable to the drag effect of the lower COR ball even with a higher exit velocity.
This leaves a traditional “Barrel” as a somewhat convoluted statistic this season in the sense that not all barrels are created equal. A batter needs to maximize the exit velocity properties of the new ball without falling victim to the drag, but while still elevating the ball.
Editor’s Note: Drafting is only half the battle! Get an edge on your competition with our MLB Season Tools - available in our EDGE+ Roto tier for $3.99/mo. (annually) or $9.99/mo. (monthly) - that are packed with rankings, projections, a trade evaluator, start/sit tools and much more. And don’t forget to use promo code SAVE10 to get 10% off. Click here to learn more!
Vulnerable Batted Balls: Launch Angle
Launch Angle is a bit of a buzzword phrase that is tossed around quite frequently these days when all it really represents is the vertical angle at which the baseball leaves the bat after being struck. Usually when Launch Angle is cited on a telecast or analysis, what you are actually seeing is the “average” Launch Angle for a player, which is calculated by dividing the sum of all Launch Angles by all Batted Ball Events.
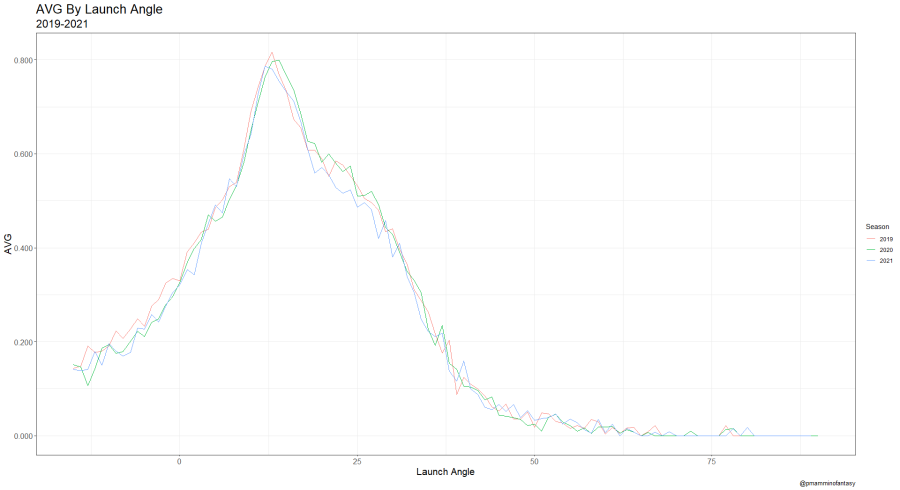
Here is a chart showing the production by Launch Angle of Batted Ball Events from 2019-2021 through batting average:
Here is a chart showing the production by Launch Angle of Batted Ball Events from 2019-2021 through slugging percentage:

As you can see in the charts above, there is a steep drop-off right in the main “Barrel” zone of 25-30 degrees in both batting average and slugging percentage, but with a vast drop-off beyond 30 degrees in slugging.
If the baseball is given more time in the air, the drag effect has more time to impact the outcome. This may have seemed like a given, but here is the data to prove that this is not witchcraft. However, we are still left with a statistic that is based on an “average,” which can be an issue.
Average Launch Angle is a fine statistic to use when evaluating pitchers, as you want to know what kind of contact the being surrendered. A lower Launch Angle would suggest a pitcher generates a lot of ground balls and therefore is more likely to avoid home runs and extra-base hits. However, this is a flawed metric for evaluating a hitter outside of individual Batted Ball Events.
A hitter’s needs can not only change with the situation but can vary dramatically. Average Launch Angle can still tell you about the tendencies of a hitter, but sd(LA) or standard deviation of Launch Angle measures bat control and consistency. The narrower the distribution of a hitter’s Launch Angle, the more consistent the contact. It should be noted that this statistic is not predictive of higher exit velocity, but it usually has a positive correlation to a players overall production.
What we need to find are players that are hitting the desired launch angle in addition to carrying a desired exit velocity that will be able to overcome the negative impact of the lower COR baseball.
Long Bombs Away: Blast Percentage
In January of 2021 Alex Chamberlain wrote an article about a unique subset of “Barrels” called “Blast” percentage. The intention of the article was to isolate elite barrels into a usable metric by eliminating Batted Ball Events with suboptimal exit velocity and Launch Angle. Well, what do you know? That is exactly what we wanted to do!
Instead of the high variance of batted balls that Barrel percentage leaves you with, Blast percentage narrows the 25.5 to 30.5 degree Launch Angle gap to 28 degrees while increasing the lowest exit velocity threshold from 97.5 miles per hour to an even 100 miles per hour. Alex found that since 2017, Statcast Barrels have been divided nearly down the middle between blasts and “weak barrels” (46% blasts to 54% weak barrels). The difference in production between Barrels, Blasts, and “weak” Barrels is fairly wide since 2017:
- Barrels: 1.416 wOBAcon, 58% home run rate, .804 batting average
- Blasts: 1.744 wOBAcon, 82% home run rate, .919 batting average
- Weak Barrels: 1.140 wOBAcon, 38% home run rate, .707 batting average
So what we want to do in order to defeat the evil drag baseball in fantasy is locate players who hit a certain threshold in “Blast percentage” while also carrying an acceptable sd(LA). We will be left with a list of players that make ideal hard contact with superior bat control.
The Worthy Shall Step Forward
It is important to remember that there are numerous variables that will impact production going forward this season that we have not discussed. Factors such as weather, foreign substance crackdown and mechanical adjustments will all play a key role in how overall production will turn out. The idea behind identifying which skill sets will be useful to counteract the lower COR baseball is just one more tool in your belt when running player analysis. Be sure to account for variable change moving forward.
That being said, here is a list of players that fit the most ideal criteria for avoiding the negative drag impact of the new baseball. To be eligible a player must have at least 50 Batted Ball Events, a Blast percentage above eight (could certainly lower to six), and a sd(LA) of 30 degrees or lower:

Players such as Jorge Soler and Yasmani Grandal are possible buy low candidates due to their underlying skill set and depressed batting average due to a lower line drive rate. Even though it is June, the season is still young and each and every player on this list has the ability to drive the ball in a way that should counteract any negative effects of the new ball. However, the players that will be the most valuable are the ones that have a line drive rate above 20 percent and a lower sd(LA). Tyler O’Neill is a fantastic example.
Picking out “negative” players is a bit more tricky. For the most part we are identifying players based on their ability to control the bat and hit for power, but some players would prefer to control the bat and hit line drives. For the sake of argument, we set parameters to identify players with high Barrel raters but low Blast percentages in order to find players who could struggle with the new baseball.

Hey! Why is Kris Bryant on this list?
Yes, you may notice a few peculiar names on this list that are performing very well at the moment. You may also notice that Kris Bryant carries a 24.7 percent line drive rate. However, the Cubs third baseman also carries a career high 21.7 HR/FB ratio. This is not to suggest that you should look to sell Bryant, but his inclusion on this list is interesting.
If you take a look at his spray chart below, you will notice that quite a few of Bryant’s home runs were wall scrapers.

According to Baseball Savant, Bryant would have his home run total cut by half in 10 major league ballparks this season and to below 10 home runs in 19 ballparks. The 29-year-old has hit just three “no-doubters” in 2021 and the data suggests that Bryant and his 16th percentile exit velocity have been lucky to a degree thus far.
Ozzie Albies is a player who is fifth in the league in fly ball percentage at the moment, but with a 2.1 percent Blast rate and a HR/FB ratio well below his career average. This is either an indication of incoming regression or the impact of the lower COR baseball. You have to take each player one at a time to determine how the puzzle pieces may fit, but this is a great way to get your compass pointed in the right direction.
This is far from an exact science and is somewhat of a moving target with so many variables changing everyday, but you should now be able to look at players in a different light and under a different lens. Offense is down across the league, but not for everyone. Learn to identify hidden value and you could find an edge in your fantasy league.
